Algorithmic Pattern Detection Transforms Greyhound Racing Forecast Evaluations
Written by Yara Krause · Aug 15, 2026
Algorithmic Pattern Detection Transforms Greyhound Racing Forecast Evaluations
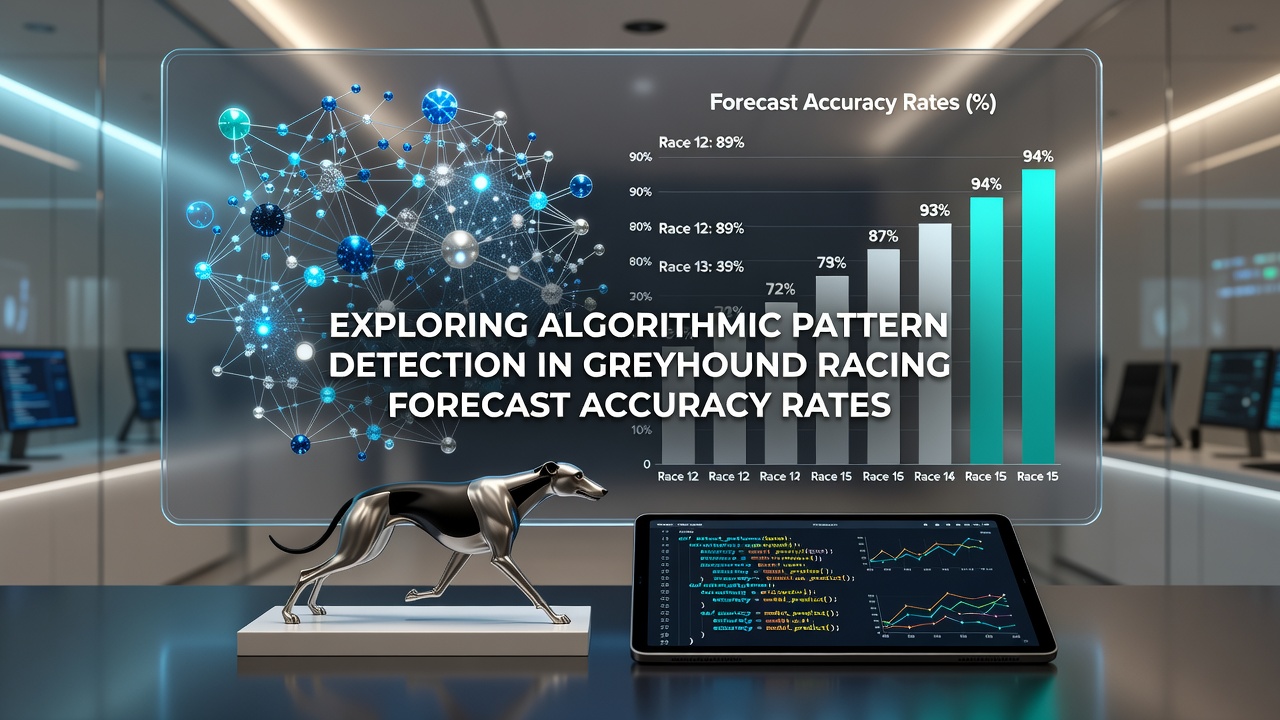
Algorithmic pattern detection now shapes how analysts evaluate forecast accuracy in greyhound racing, where machine learning models process large datasets of race results, track conditions, and historical performance metrics. Researchers apply clustering techniques and neural networks to identify recurring sequences that traditional statistical methods often overlook, and these approaches have gained traction since early 2025 when several academic teams released updated frameworks for animal racing data.
Core Methods Behind the Detection Process
Pattern detection begins with data ingestion from official racing databases, where algorithms scan variables such as trap position, sectional times, and trainer win percentages across thousands of past events. Supervised learning models train on labeled outcomes to predict probability distributions, while unsupervised methods surface hidden correlations like specific weather impacts on certain track surfaces that appear only when data spans multiple years. Observers note that combining random forest classifiers with time-series analysis produces tighter confidence intervals than single-model approaches, and this layered technique appears in reports issued by institutions including the University of Melbourne's sports analytics group.
One study released in mid-2026 examined over 180,000 greyhound starts from Australian tracks and found that algorithmic systems flagged accuracy improvements of 12 to 18 percent when they incorporated real-time betting market movements as an additional feature. The same work showed that models without market data lagged behind those that integrated it, particularly in races run on wet surfaces where public odds shifted rapidly in the final minutes before the start.
Accuracy Rate Trends Across Different Track Types
Forecast accuracy varies noticeably between grass and synthetic surfaces, and algorithms have quantified these differences through longitudinal comparisons. Data compiled through August 2026 indicates that prediction models achieve higher precision on all-weather tracks, where environmental variables remain more stable, compared wth turf venues that introduce greater variability from rainfall and temperature fluctuations. Analysts at research centers in North America have cross-referenced these findings with records from the Canadian Pari-Mutuel Agency, confirming similar surface-based differentials in regional greyhound events.
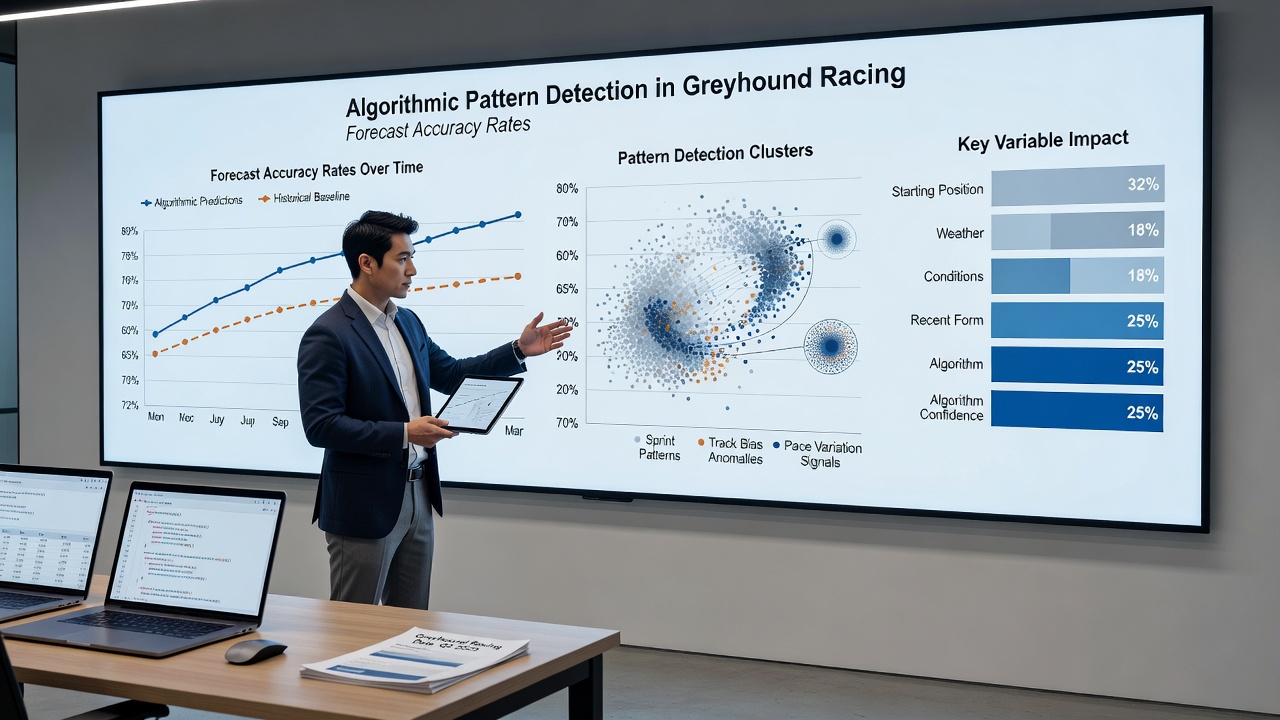
Seasonal patterns also emerge clearly under algorithmic scrutiny. Summer months typically produce steadier accuracy rates because consistent temperatures reduce variance in dog performance, whereas winter data sets require additional normalization steps to account for colder conditions that slow overall times. Experts processing these seasonal splits report that models retrained quarterly maintain better calibration than those updated annually, and this frequency aligns with recommendations from several European racing federations that publish quarterly performance bulletins.
Integration with Existing Forecasting Workflows
Tipster services and professional handicappers have begun embedding algorithmic outputs into their regular processes, feeding model-generated pattern alerts into existing spreadsheets and decision trees. This hybrid workflow allows human reviewers to focus on edge cases where the algorithm assigns lower confidence scores, such as debutant greyhounds or trainers returning after extended breaks. Those who have adopted these tools note reduced time spent on initial data filtering, freeing resources for deeper qualitative assessment of form lines and pedigree factors.
Academic papers presented at the 2026 International Conference on Sports Analytics highlighted case studies from both Australian and Irish greyhound circuits, where algorithmic pattern detection identified previously unrecognized trainer-specific biases in race selection. One such study demonstrated that certain handlers consistently entered dogs into events where historical accuracy rates for similar profiles exceeded 35 percent, a signal that remained buried in raw spreadsheets until clustering algorithms isolated it.
Challenges in Model Validation and Data Quality
Despite these advances, validation remains an ongoing concern because greyhound racing datasets often contain gaps in older records and inconsistencies in how sectional times were measured before digital timing became standard. Researchers address this through imputation techniques and sensitivity testing, yet the resulting accuracy figures still carry wider margins of error for pre-2018 data. Regulatory bodies in multiple jurisdictions now require documented model audit trails when operators use algorithmic forecasts to inform promotional materials or customer tools, a step intended to maintain transparency around how predictions reach the public.
Cross-border data sharing agreements have helped expand sample sizes, allowing models trained on combined UK, Australian, and US records to generalize more effectively. These expanded pools reveal that certain pattern signatures, such as late-closing dogs performing better after specific rest intervals, transfer across regions with only minor recalibration, while others prove highly location-specific and demand local tuning.
Conclusion
Algorithmic pattern detection continues to refine the evaluation of greyhound racing forecast accuracy by surfacing relationships that span large historical datasets and multiple variables. As more organizations adopt these methods and validation standards tighten, the field moves toward more consistent measurement frameworks that benefit both analysts and participants across different racing jurisdictions.